

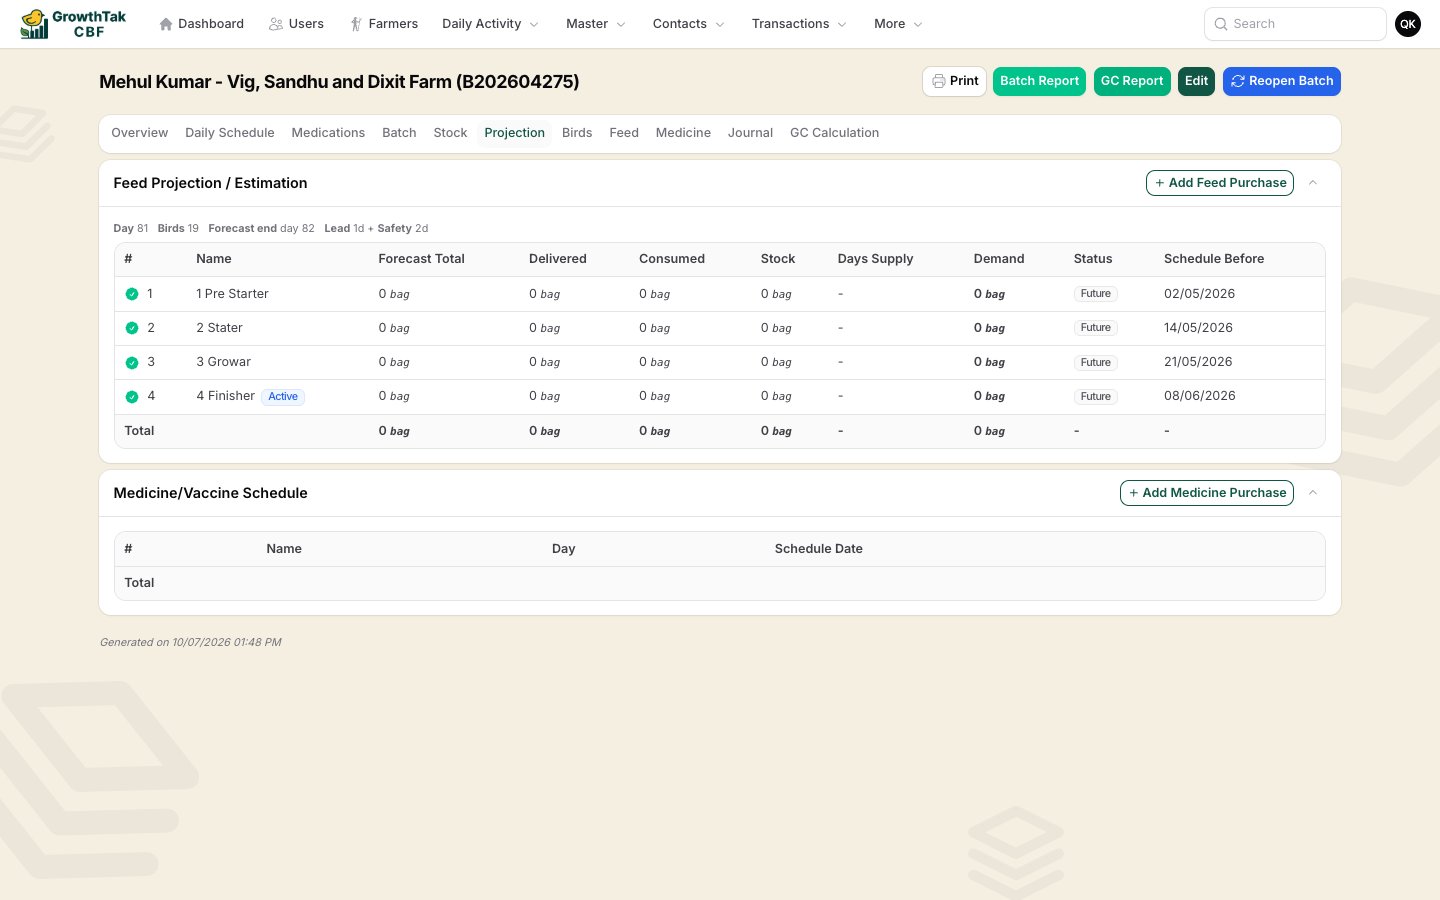
The Projection tab — one row per feed grade, with forecast, stock, days of supply, and a reorder status.
The batch in this screenshot has finished, so its rows read zero. On a running batch the figures are live and the Status column drives your ordering.
What you need first
The forecast only runs when all three are in place:1
A bird profile on the batch
Supplies the standard daily feed per bird for each day of age. It is the basis of the Breed standard method, and a profile is required for either method to run. See Product profiles.
2
A batch program with feed rows
Sets the feed grades, their Quantity per Bird, and the program’s Feed projection method. See Batch programs.
3
Birds placed
A completed Bird Purchase gives the placement date and the starting bird count.
Choosing how the forecast is calculated
Each batch program carries a Feed projection method, and every batch on that program uses it. The two methods differ only in where each feed grade’s target comes from:Breed standard
The grade’s target is the standard feed per bird (from the bird profile) added up across that grade’s days, times the birds alive today.
Program quantity
The grade’s target is the Quantity per Bird you typed on its feed row, taken as a fixed quota, times the birds alive today. The program Days are treated as estimates.
How the forecast is built
Whichever method is set, the shape is the same: each feed grade gets a target — the total it should consume over the batch — and the demand to order is that target minus what’s already been delivered.Anchored to today's live birds
Anchored to today's live birds
Both methods multiply the per-bird figure by the birds alive right now — placed, minus sold, minus mortality recorded so far. There’s no day-by-day guess at future deaths: as birds are lost the targets ease down with them, and as you record entries the forecast keeps pace.
Conserving target — Breed standard
Conserving target — Breed standard
A grade’s target is its standard feed-per-bird summed over the grade’s days, times today’s birds. The remaining forecast is that target minus what’s already been eaten, never below zero — so eating a bit over or under plan doesn’t inflate or shrink the total. A grade whose days have fully passed is not re-projected.
Hard quota, days are estimates — Program quantity
Hard quota, days are estimates — Program quantity
A grade’s target is its Quantity per Bird times today’s birds. The remaining forecast is that quota minus what’s been eaten. The program Days aren’t hard cut-offs here — a grade is finished when its quota is used up, and the next grade begins from that point.
Which grade is active
Which grade is active
The grade carrying the Active badge is the first one whose quota isn’t finished. Every grade before it shows Done — once the flock has moved on to a later grade, an earlier one is closed even if a little of its quota went unused. This follows what was actually fed, not the calendar.
There is no usage “calibration” — both methods are deterministic, so the totals don’t swing with a single over- or under-fed day. Recording day entries still matters: consumption is what decides which grade is active, the Days Supply timing, and the Schedule Before dates.
Reading the table
One row per feed grade in the batch program.
The strip above the table shows the batch’s current Day, live Birds count, the Forecast end day, and the batch’s Lead and Safety settings.
Lead time and safety stock
Two settings on each batch turn the forecast into a reorder decision. Set them when you create or edit the batch.
Neither setting changes how much feed is forecast — they decide when you get warned.
Status meanings
Worked example — lead time 1 day, safety stock 2 days. At 3 days of supply or less you see Order Soon; at 1 day or less it becomes Order Now.
Ordering from the projection
Rows that still need feed show a Buy button next to the status. It opens a new Feed Purchase with the batch, the feed grade, the unit, and the demand quantity already filled in — you only add the supplier, rate, and date. The Add Feed Purchase button in the section header does the same for the batch, without pre-filling a grade or quantity.The Feed Stock alert
You don’t have to open each batch to find the ones at risk. The Feed Stock tab in the dashboard Alert Center lists every batch-and-grade pair currently sitting at Order Now or Order Soon, across all your active batches.- Rows are sorted most urgent first — Order Now before Order Soon, then fewest days of supply.
- Each row shows the farm, the batch, the feed grade, and the days of supply remaining.
- Selecting a row opens that batch straight on its Projection tab.
- Admins can narrow the list with the supervisor filter; supervisors see only their own assigned batches.
This tab computes live each time the dashboard loads, so it may take a moment longer to fill in than the other alert tabs. The figures are never stale.